


Launch winning ads in minutes with high performing ad templates.


ROAS, or Return on Ad Spend, is one of the most important metrics that evaluates how well your Facebook ads are performing. It tells you how much revenue your Facebook advertising generates compared to how much you spend.
While the common rule of thumb for most digital marketers is a 4:1 ratio, what counts as “good” ROAS highly depends on the industry, profit margins, and a dozen other factors.
In this guide, you'll learn:
- How to figure out your ROAS for Facebook Ads
- Why ROAS benchmarks are different for every industry
- What the latest numbers say about average Facebook ROAS
- How to understand your ROAS based on your business goals
- Simple ways to start improving your ROAS over time
By the end, you’ll know how to set a realistic ROAS goal for your business and the changes you can make to achieve it.
What’s ROAS about? 30-sec recap
- ROAS means how much money you make from your ads compared to what you spend. Formula: ROAS = Revenue ÷ Ad Spend.
- Industry averages are useful, but they don’t tell you what’s “good” for your business. That depends on your costs and profit margins.
- Know your break-even ROAS, or the number you need to hit just to cover your costs. Anything higher is profit.
- ROAS isn’t everything. You should also look at CAC (Customer Acquisition Cost), LTV (Lifetime Value), and your profit margins.
- Warning signs: your ROAS drops below break-even, your results worsen even though you’re spending the same, or your costs are rising with no extra sales.
- Stay flexible. Your audience, ads, and the market can change, so keep testing and adjusting to stay ahead.
Understanding ROAS and Why It Matters

ROAS measures how much revenue you earn for every dollar spent on advertising. The formula is simple:
ROAS = (Revenue / Ad Spend) x 100
So if you spend $1,000 on ads and make $5,000 in sales, your ROAS is 5.0. That means you earned $5 for every $1 you spent.
ROAS is different from ROI (Return on Investment). ROI looks at all your business costs. ROAS only looks at your ad performance.
- A high ROAS means your ads are making sales.
- A low ROAS might mean your ads need work; maybe they’re not reaching the right people, or the ad content isn’t as good.
How ROAS is calculated on Facebook
Facebook uses the Facebook Pixel to track what people do after they click or see your ad, like buying something or signing up. Facebook then compares that to how much you spent on the ad.
Your attribution window (like 7 days after a click or 1 day after a view) decides how long the advertising platform tracks that user’s actions. Because of that, your ROAS can look very different depending on how you set up tracking or define a “conversion.”
This means your ROAS calculation is never static, as ROAS data changes depending on campaign objectives, ad format, and even how Facebook attributes immediate sales versus delayed ones.
Defining “Good” in the Context of ROAS
As we've mentioned, there’s no one single answer to what a “good” ROAS is. A number that works great for one business might be a bad sign for another, and it all comes down to profit margins.
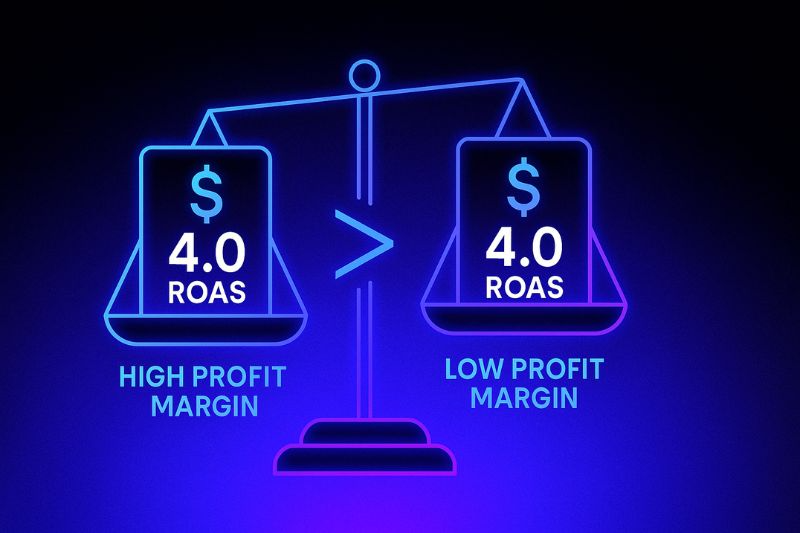
Let’s say two businesses both have a ROAS of 4.0 (they earn $4 for every $1 spent).
- If one business has a high profit margin (like 70% in a SaaS company), that 4.0 ROAS means real profit.
- But if another business has a low profit margin (like 20% on a physical product), that same ROAS barely covers costs. They’re not losing money, but they’re not making much either.
Here’s the point: going after a ROAS benchmark without knowing your own profitability threshold can make you cheer for numbers that don’t actually put money in the bank.
Industry Benchmarks That Put ROAS in Perspective
Looking at industry averages can help give some context. Platforms like Varos share data to show what other businesses are getting from Facebook Ads. Here’s a quick look:
- Overall median: 2.19
- Low performers: Healthcare – 1.19, B2C SaaS – 1.32
- Mid performers: Beauty – 1.57, Food & Beverage – 1.69, Furniture – 4.67
- High performers: Automotive Parts – 6.76, Hotels – 4.83, SEO Services – 4.60
Why do these differences exist?
- Product Type & Price: Expensive products (like car parts) bring in more money per sale.
- Audience Size & Buying Frequency: Everyday products sell often but have lower profit per sale.
- Competition & Seasonality: More competition means higher ad costs, which can lower ROAS.
Using benchmarks like this gives you a directional view. But keep in mind that they’re benchmarks, not goals. Your business’s break-even point and profit targets should determine what ROAS is valuable to you.
When you keep both your internal profitability data and external benchmarks in focus, you stop chasing someone else’s “good” and start defining your own good ROAS performance.
Reading the Signs: When ROAS Is Talking to You
ROAS can give you a lot of feedback on your campaign performance. If it’s dipping below your break-even point, that’s an immediate signal your advertising spend isn’t covering costs, let alone making a profit.
Some signs to watch out for:
- Steady spend, declining returns: If you’re pumping the same advertising budget into a campaign but getting less back, it's likely because your audience is tired of your ads or your creative isn’t working anymore. Time to switch it up.
- Your costs go up, but sales don’t: If your CPM (cost per 1,000 views) or CPA (cost per sale) are going up but your results stay the same, the problem could be with your ad targeting, bidding strategy, or ad quality.
Most of the time, low ROAS isn’t just Facebook’s fault but rather your offer, your landing page, or who you’re targeting.
Why ROAS Isn’t the Whole Story
It’s tempting to celebrate a “good” ROAS, but that can be misleading if you’re not looking at the bigger financial picture.
Let’s say you get a ROAS of 4.0. That means you made $40,000 from $10,000 in ads. On paper, it’s a win! But if your product costs, shipping, and other business expenses total $38,000…You actually lost money.
ROAS tells you how efficiently your ad dollars are generating revenue, but it doesn't take profit into account. Combine it with other metrics:
- CAC (Customer Acquisition Cost): How much it costs to get a new customer.
- LTV (Customer Lifetime Value): How much money that customer brings in over time.
- Gross Margin: How much profit you keep after expenses.
Looking at all of these together is a much better method to determine if your Facebook ad campaigns are working, and that means not just bringing in sales, but bringing in profit.
Your ROAS doesn’t need to be just “average.” With Static Flow, you’ll get custom ad strategies built around your margins, goals, and industry benchmarks, so every dollar spent has a job. See how it works
Creative and Strategy: The Levers You Control

Not everything is in your hands when it comes to Facebook ads, so let's see what you can control.
First up, audience.
A well-defined target audience is how great ROAS starts. Even the best creatives can’t save ads shown to the wrong people.
- Use Facebook’s detailed targeting options to narrow in on high-intent users.
- If your product is something people only buy once, stop showing ads to people who have already bought it. Or, if they can buy again, make a new offer just for them.
- Lean on lookalike audiences built from your highest LTV customers to scale without losing quality.
When you’re showing ads to people most likely to buy, every dollar has a better chance of coming back multiplied.
Test and Refine Ad Creatives
Creative fatigue is one of the fastest ways to ruin a good ROAS. Keep ads fresh by testing:
- Formats: Carousel ads for multiple products, collection ads for immersive mobile browsing, short-form video for quick hooks.
- Angles: Different benefits, social proof, urgency-driven messaging.
- CTAs: Even small tweaks to your call-to-action (CTA) can get more clicks
Test with purpose, one variable at a time, so you know what actually moved the needle.
Optimize Landing Pages
Perfect targeting and polished creative won’t survive a landing page that leaks conversions.
- Keep load times under three seconds.
- Match the headline and offer directly to your ad copy.
- Remove unnecessary steps or form fields so buying feels effortless.
Every click you pay for should land on a page that makes it easy for people to say “yes.”
Pulling It Together: Context, Margins, and Agility

Benchmarks are helpful. They give you a general idea of where you stand; are your ads doing better, worse, or about the same as others in your space? But they’re just that: context.
The number that really matters for setting your ROAS target is your profit margin. If your business spends 70% of what it earns on making and shipping the product, you need a much higher ROAS to make any profit than someone who only spends 40%.
Your break-even ROAS is the point where your ad earnings just cover your costs. No profit yet, but at least you’re not losing money. Anything above that is growth. Anything below it means you’re paying to lose.
The aim isn’t to chase the highest ROAS you’ve seen in some report but to keep advertising campaigns profit-positive while staying flexible. Markets change, CPMs go up, and audiences always want the next big thing. The advertisers who win long-term are the ones adjusting budgets, creatives, and targeting with both the bigger market context and their own margin realities in mind.
Frequently Asked Questions

1. How do I accurately calculate ROAS for Facebook ads?
The formula is: ROAS = Revenue from Ads ÷ Ad Spend
For example, if you spent $500 and earned $2,000 in tracked sales, your ROAS would be 4.0.
2. What is considered a “good” ROAS for Facebook ads?
Ideal ROAS for Facebook ads depends on many factors. Some businesses do fine with a 2.0, while others need a 6.0 or more to stay profitable. It all comes down to your costs and profit margin.
3. Why is my ROAS lower than industry benchmarks?
It could be tired ad creatives, poor audience targeting, heavy competition, or a landing page that isn’t converting. Benchmarks are just reference points, and your break-even numbers are generally more important.
4. Is ROAS the same as ROI?
No. ROAS only looks at revenue vs. total ad spend. ROI factors in all costs, including production, shipping, and overhead, to show true profit.
5. How can I improve my ROAS on Facebook ads?
Test new creatives, refine your targeting, improve your landing pages, and monitor your campaigns closely. Even small changes can compound into higher returns on your marketing efforts.
6. Why does Facebook show a different ROAS than my store analytics?
Usually, it’s down to attribution windows, ROAS tracking setup, or data delays. Double-check that your Facebook Pixel and conversion tracking are configured correctly in your Facebook Ads Manager.
Conclusion: Forget the magic number
A “good” ROAS is one that helps your business make money and keep growing. Sure, industry average ROAS can give you an idea of what others are seeing, but your own profit margins, costs, and customer value matter way more.
The real advantage comes from staying flexible. That means testing new ads, refining your targeting, and optimizing your landing pages to consistently deliver good results over time.
ROAS is essentially a tool. It should help you make better choices, not be the only thing you're after. And in the end, the best ROAS is the one that works for you. No one else can decide that.
Your Facebook ROAS is only part of the story. With Static Flow, you can finally connect the dots between ad spend, LTV, and profit. Start for free today and see what your campaigns are worth.
.svg)


.avif)